Regions of Interest (ROIs), such as buildings, tools, faces or animals, can be well defined in narrative paintings, but are less obvious in abstract painting and completely obscure in Jackson Pollock’s drip-paintings. However, even in the absence of image regions that depict objects, observers’ gaze can be drown to specific regions in which objects emerge that can be attached to semantic labels: ‘Pareidolia’. We developed a simple data-driven method to localise such hotspots, in an attempt to characterise their exploration during extended viewing time.
Analyses flow – step 3: The automatic detection of a sequence of gaze hotspots in decreasing preference was achieved iterations n = 1 to 20, consisting of four stages of processing individual fixation data:
- stage 1: application of Gaussian filter to the current fixation distribution: smoothing
- stage 2: identify the location of the peak of the fixation distribution (‘hotspot’ for iteration n, characterised by its position and half-width)
- stage 3: remove 60% of fixation distribution around this peak: elimination
- stage 4: increment n, and go back to stage 1
This animation illustrates for one participants the iterative process (20 steps) of smoothing and elimination fixation distributions (shown in grey-scale, where maxima are represented in black), to identify a subsequent gaze hotspots of decreasing preference (participant RED-11).
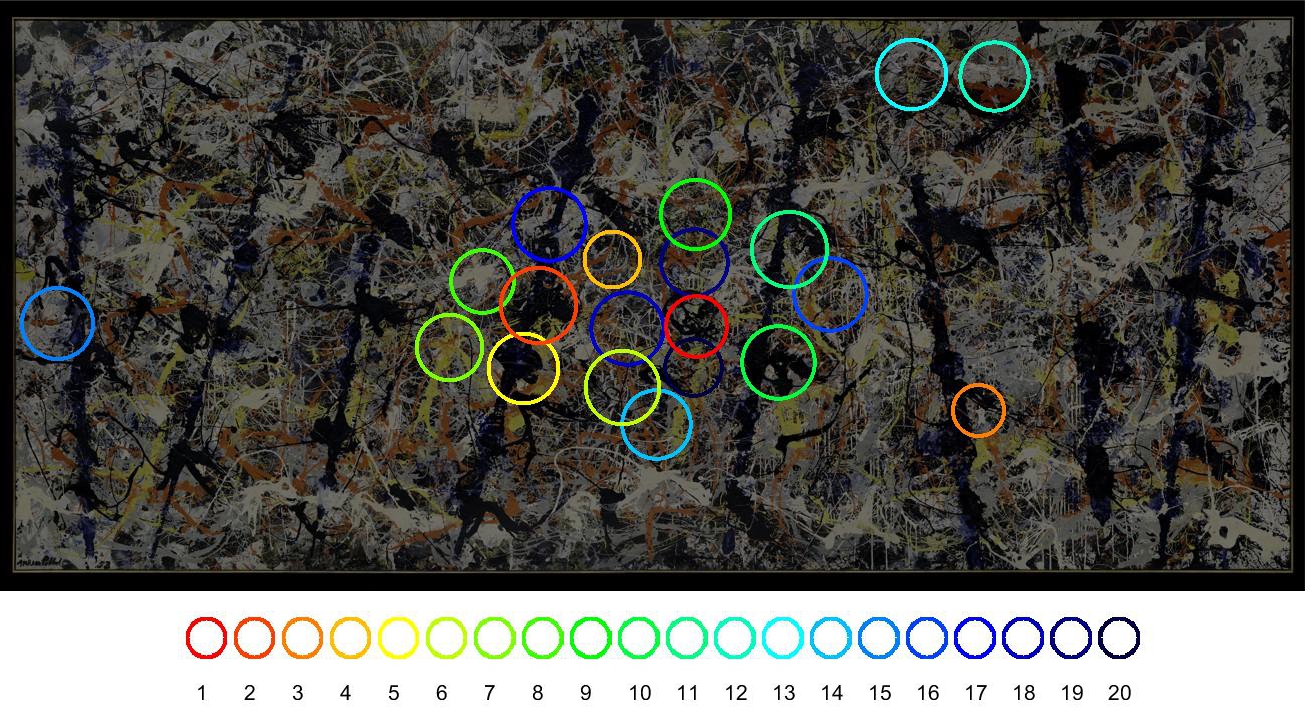
Gaze hotspots of decreasing preference (order indicated by colour scale) and half-width size (diameter of circles), superimposed on ‘Blue Poles’ painting.